Nivo Charts for D3 Data Visualization in React
Introduction
Let's build a neat little React bar chart to display the Local Seven Day Temperature Forecast using the Nivo Chart Library for React. We can use the weather API from openweathermap.com to get the weather data. When we are done you should end up with a chart that looks like this.
Requirements
- Node and npm installed on your machine.
Topics Introduced
- The Nivo Library (Specifically the BarGraph component)
- The Open Weather Map API
- Fetching data in React using React Query.
- Using the Browser Geolocation API to get the users GPS coordinates.
Step 1: Sign up for an Open Weather Map Account to get an API Key
You will need your own API key from Open Weather Map. So the first step is to go to Open Weather Map and create an account. Once your account is created you should see a tab that says API keys. Click on that tab to get your API key. For now just keep note of it so we can use it later.
Step 2: Bootstrap an Empty React App
Next let's set up a React App using create-react-app. To do this just run.
npx create-react-app weather-chart
This creates a new directory called weather-chart and bootstraps a fresh React App inside.
Step 3: Fetch the Forecast Data from the Open Weather Map API in the React App
If we want to chart data, first we need some data to chart, so let's fetch the forecast from the API.
Install some NPM dependencies to assist us in data fetching.
Run this command in the project root of the React project you just created.
npm i -S react-query axios
React Query is used to coordinate the data fetching, and Axios is a helpful http requests library to simplify the get request to the API.
Write some code to help with fetching data from the API
Next create a file called config.js to store your Open Weather Map API key from the first step. It should export your api key like this. We will use this exported value to make the request in the next step.
// config.js
export const apiKey = "6d1e48c8fd7e72a29a7d71f7b3bc5603";
Then create a file called queries.js in the project folder with this code. The getDailyWeather function is an async function for react-query to fetch data from the API. Inside it awaits the async axios.get which makes a request to the Open Weather Map One Call API endpoint. This endpoint provides all of the forecast information for a specific set of coordinates. Notice how the lat and lng values, as well as the apiKey are templated into the URI. If you don't provide all of these values the request will fail.
There are some additional optional settings you can provide for this API endpoint, to learn more check out the documentation One Call API Endpoint
//queries.js
import axios from "axios";
import { apiKey } from "./config";

const getDailyWeather = async (key, { lat, lng }) => {
  if (lat && lng) {
    const { data } = await axios.get(
      `https://api.openweathermap.org/data/2.5/onecall?lat=${lat}&lon=${lng}&units=imperial&appid=${apiKey}`
    );
    return data;
  }
  return null;
};

export { getDailyWeather };
Write some code to get the users Latitude and Longitude so We can use it in the API Request
Create a new file called usePosition.js with the following code. We can use the GeoLocation API to get the latitude and longitude data from the browser. This is a custom geo-location React hook we will be able to use inside of our component before calling the API.
// usePosition.js
import { useState, useEffect } from "react";
export const usePosition = () => {
  const [position, setPosition] = useState({});
  const [error, setError] = useState(null);

  const onChange = ({ coords }) => {
    setPosition({
      lat: coords.latitude,
      lng: coords.longitude,
    });
  };
  const onError = (error) => {
    setError(error.message);
  };
  useEffect(() => {
    const geo = navigator.geolocation;
    if (!geo) {
      setError("Geolocation is not supported");
      return;
    }
    geo.getCurrentPosition(onChange, onError);
  }, []);
  return { ...position, error };
};
Wire All the Pieces Together to Fetch Data
Back in the App.js file import all 3 of the following packages.
- useQuery from react-query,
- the getDailyWeather query from ./queries
- and the usePosition hook from ./usePosition
Now that we have all of that imported, you should be able to use the useQuery hook from react-query by passing in the getDailyWeather query we created, and the latitude and longitude from the usePosition hook we created. Try console logging the value of data to double check that this is working before moving forward. You could also take this opportunity to add a loading state but it is not required, the chart we plan to build will render correctly even with no data.
import React from "react";
import { useQuery } from "react-query";
import { usePosition } from "./usePosition";
import { getDailyWeather } from "./queries";
import "./styles.css";

export default function App() {
  const { lat, lng } = usePosition();
  const { data } = useQuery(["dailyWeather", { lat, lng }], getDailyWeather, {
    refetchOnWindowFocus: false,
    refetchOnMount: false,
  });

  return <div className="App"></div>;
}
Step 4: Build up the Bar Chart Component in The React App
The component is now fetching the weather forecast data. Let's add in the Bar chart component from Nivo to graph those temperatures.
First install the NPM package for the bar chart from Nivo into the project.
npm i -S @nivo/bar
Next import the Bar component from this package into the App.js file and add it to the App component as seen below.
import React from "react";
import { useQuery } from "react-query";
import { Bar } from "@nivo/bar"; //highlight-line
import { usePosition } from "./usePosition";
import { getDailyWeather } from "./queries";
import "./styles.css";

export default function App() {
  const { lat, lng } = usePosition();
  const { data } = useQuery(["dailyWeather", { lat, lng }], getDailyWeather, {
    refetchOnWindowFocus: false,
    refetchOnMount: false,
  });

  return (
    <div className="App">
      //highlight-next-line
      <Bar />
    </div>
  );
}
You add settings to the Bar component by setting them as props on the Bar component. There are many of them so you may want to refer to the Nivo Bar Documentation to see what they all do. Here are the ones we need to build our chart. We also need to tell the chart the labels for our groups so we create some constants to store the days of the week, and the times of day we want to display.
import React from "react";
import { useQuery } from "react-query";
import { Bar } from "@nivo/bar";
import { usePosition } from "./usePosition";
import { getDailyWeather } from "./queries";
import "./styles.css";
// highlight-start
const DAYS_OF_THE_WEEK = ["Sun", "Mon", "Tue", "Wed", "Thurs", "Fri", "Sat"];
const keys = ["morning", "afternoon", "evening", "night"];

const commonProps = {
  axisLeft: {
    tickSize: 5,
    tickPadding: 5,
    tickRotation: 0,
    legend: "Temperature",
    legendPosition: "middle",
    legendOffset: -60,
  },
  width: 900,
  height: 800,
  margin: { top: 60, right: 80, bottom: 60, left: 80 },
  enableLabel: false,
  indexBy: "dt",
  keys,
  padding: 0.2,
  labelTextColor: "inherit:darker(1.4)",
  labelSkipWidth: 16,
  labelSkipHeight: 16,
};
//highlight-end
export default function App() {
  const { lat, lng } = usePosition();
  const { data } = useQuery(["dailyWeather", { lat, lng }], getDailyWeather, {
    refetchOnWindowFocus: false,
    refetchOnMount: false,
  });

  return (
    <div className="App">
      //highlight-next-line
      <Bar {...commonProps} groupMode="grouped" />
    </div>
  );
}
Finally it's time to connect the data to the chart. In order to do that we need to take the data from the API response and transform it into a shape the Nivo Bar component can understand. Let's use the Javascript Ramda package to help with that process.
First add Ramda to your project dependencies, just like before
npm i -S ramda
When the data originally comes back from the API it looks like this.
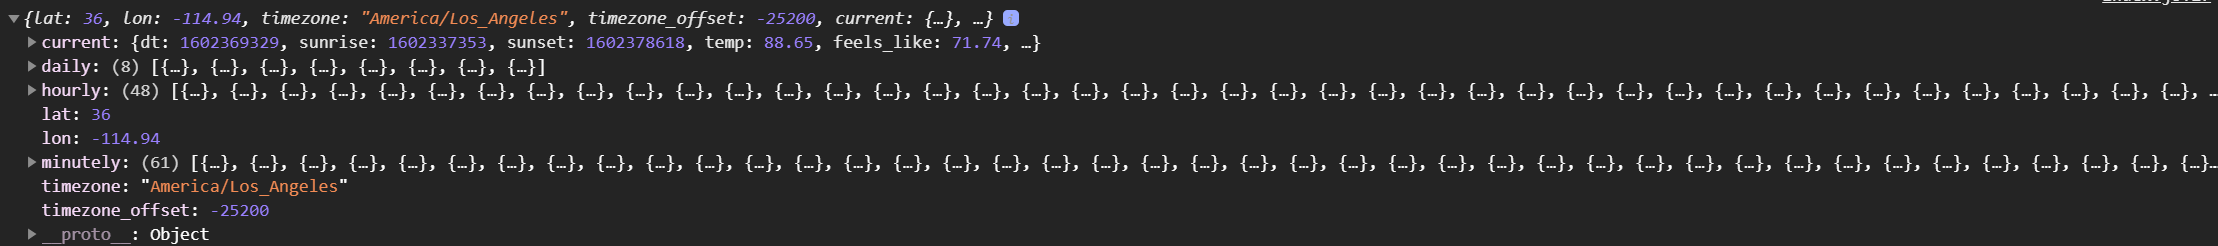
Most of this is not needed for our chart, and the Bar component can't understand the structure anyways. We need to greatly simplify it.
We need it to be formatted in a simple easy to understand format. Specifically the Nivo Bar component expects an array of grouped values.
[
  {
    "dt": "Sat",
    "morning": 64.76,
    "afternoon": 83.82,
    "evening": 87.73,
    "night": 72.82
  },
  {
    "dt": "Sun",
    "morning": 65.34,
    "afternoon": 79.02,
    "evening": 86.74,
    "night": 71.02
  },
  {
    "dt": "Mon",
    "morning": 63.34,
    "afternoon": 81.7,
    "evening": 90.97,
    "night": 71.62
  },
  {
    "dt": "Tue",
    "morning": 65.25,
    "afternoon": 84.81,
    "evening": 92.88,
    "night": 72.81
  },
  {
    "dt": "Wed",
    "morning": 66.11,
    "afternoon": 87.08,
    "evening": 93.18,
    "night": 74.44
  },
  {
    "dt": "Thurs",
    "morning": 67.41,
    "afternoon": 83.3,
    "evening": 91.02,
    "night": 70.83
  },
  {
    "dt": "Fri",
    "morning": 62.71,
    "afternoon": 81.57,
    "evening": 90.21,
    "night": 71.2
  },
  {
    "dt": "Sat",
    "morning": 65.07,
    "afternoon": 87.12,
    "evening": 94.53,
    "night": 75.18
  }
]
The highlighted lines below are the code to make that transformation and to pass in the new transformed data to the Bar chart.
import React from "react";
import { useQuery } from "react-query";
import { Bar } from "@nivo/bar";
import * as R from "ramda";
import { usePosition } from "./usePosition";
import { getDailyWeather } from "./queries";
import "./styles.css";

const DAYS_OF_THE_WEEK = ["Sun", "Mon", "Tue", "Wed", "Thurs", "Fri", "Sat"];
const keys = ["morning", "afternoon", "evening", "night"];

// Settings for rendering the Nivo Bar Graph
const commonProps = {
  axisLeft: {
    tickSize: 5,
    tickPadding: 5,
    tickRotation: 0,
    legend: "Temperature",
    legendPosition: "middle",
    legendOffset: -60,
  },
  width: 900,
  height: 800,
  margin: { top: 60, right: 80, bottom: 60, left: 80 },
  enableLabel: false,
  indexBy: "dt",
  keys,
  padding: 0.2,
  labelTextColor: "inherit:darker(1.4)",
  labelSkipWidth: 16,
  labelSkipHeight: 16,
};
export default function App() {
  const { lat, lng } = usePosition();
  const { data } = useQuery(["dailyWeather", { lat, lng }], getDailyWeather, {
    refetchOnWindowFocus: false,
    refetchOnMount: false,
  });

  // Transforms the API response data into Nivo Bar chart formatted data.
  // Because the API uses timestamps to denote the days, we map them to a pretty day of the week label for display.
  // highlight-start
  const transformFromApiToChartData = (item) => {
    return {
      dt: DAYS_OF_THE_WEEK[new Date(item.dt * 1000).getDay()],
      morning: item.temp.morn,
      afternoon: item.temp.day,
      evening: item.temp.eve,
      night: item.temp.night,
    };
  };

  // Safely selects daily forecast from API response, and maps over it with the transformFromApiToChartData to transform.
  const chartData = R.compose(
    R.map(transformFromApiToChartData),
    R.pathOr([], ["daily"])
  )(data);
  // highlight-end

  return (
    <div className="App">
      //highlight-next-line
      <Bar {...commonProps} data={chartData} groupMode="grouped" />
    </div>
  );
}
If everything worked you should now have a nice bar chart for the next 7 days displaying the forecasted temperature for morning, afternoon, evening, and night.